Bjorn's Fancy Charts
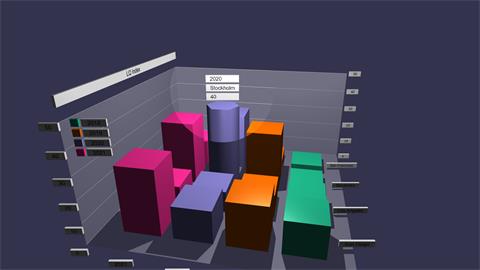
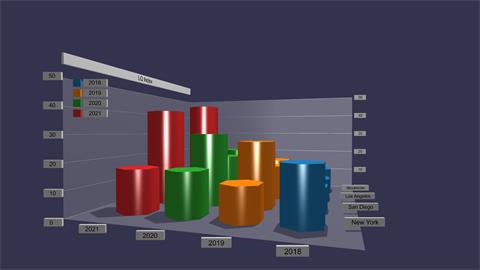
Design and insert (web)3D charts
- a Google Slides extension -
Turn your data into interactive and animated spinning 3D charts!
Great for multi-series comparisons.
Customize your charts using a myriad of options, e.g.
- Column-based charts
- Scatter-based charts
Column-based charts
- Columns
- Columns - by row
- Columns - stacked
- Columns - animated over time
- Stonehenge
- Stonehenge - stacked
- Stonehenge - animated over time
- Inselbergs
Bar types:
- Cuboid
- Cylinder
- Triangular prism
- Pentagonal prism
- Hexagonal prism
- Octagonal prism
- Auto-rotate through above types (each series get its own type)
Animations
- All bars - e.g. make all bars rotate
- Max value bars - e.g. make a max value bar bounce up and down
- Min value bars - e.g. make a min value bar rotate fast
- Camera - e.g. make the camera rotate the scene
And many many more options - launch the app and try it for yourself!
Scatter charts
Defined by three data columns, X, Y, Z.
Use Group, Color and Size columns to add more dimensions. You can set group-specific markers and colors.
Color schemes
- Fixed (one color)
- By group - rows with same group shares color
- By label - rows with same label shares color
- By row - one color by row
- Color column - color set in a source data column
- Camera - e.g. make the camera rotate the scene
- Gradient by X value
- Gradient by Y value
- Gradient by Z value
- X,Y,Z as a RGB-color
- X,Y,Z as a HSL-color
Marker types
- Rotate by group
- Sphere
- Cubiod
- Tetrahedron
- Octahedron
- Dodecahedron
- Icosahedron
- Rhombicuboctahedron
Export
Export charts to:
- PNG still image
- Interactive 3D-art landing page - see Bjorn's Doorways below
- video (WEBM format)
- animated GIF
Save exported animations to :
- Gdrive
- Google Photos
- Local hard drive
Publish to Bjorn's Doorways
You can publish your 3D chart as a 3D landing page piece of art to Bjorn's Doorways with the click of a button.
Bjorn's Doorways
Interactive 3D landing pages for your online content.
Bjorn's Doorways is a web app for viewing and interacting with 3D art - art created with assorted Bjorn's Playground apps and add-ons.
The main purpose of Doorways is to act as a portal (landing page) for online content (e.g. presentations / Google Slide decks).
The user can zoom in, rotate and interact with your 3D art before clicking the optional link that will take him or her to the final destination (e.g. your slideshow).
Hint: in the sample below, you can zoom the camera with SHIFT+mousewheel.
More
Check out this short YouTube video.
Check out screenshots and install from the Google web store.
Other platforms
Check out these other versions for other platforms.
See also
You might also be interested in these other apps or add-ons.
 Bjorn's Slides-in-3D - a Google Slides extension
Turn your Google Slides into an interactive and animated 3D world
Create stunning (online) presentations
 Bjorn's Fancy Charts - a web app
Have fun with 3D charts
Pricing
This add-on is in the TIER-1, a TIER-1 subscription costs $8.95 per month.
You can try the add-on for 7 days for free.
Note that a TIER-1 subscription covers all TIER-1 products.
There is a 5-user subscription with a great discount, $29.95 per month.
Use Bjorn's Account Manager to buy/manage your subscription.
Use your PayPal account to cancel your subscription.
Support
Note - if you have installed the add-on and the add-on submenu only contains the 'Help' option - PLEASE RELOAD THE DOCUMENT - and the other options will appear.
Please report bugs here or reach out 2 me with questions @ support@backlund.org.
Follow me at Instagram @bjornsplayground and check out more videos at my YouTube channel.
You can view our privacy policy here.


